DATA ANALYSIS PACKAGE SYMBOL
FigColumn

FigColumn[datatable1,x]
returns a figure with vertically arranged panels plotting variable x vs. all other columns in the DataTable using the SciDraw package.
FigColumn[datatable,x,{ycol1,ycol2,..}]
returns a figure with vertically arranged panels plotting variable x vs. columns ycoli in the DataTable using the SciDraw package.
FigColumn[{dt1,dt2,..},x]
plots the variables for DataTables dti.
- Using FigColumn requires that the SciDraw package, created by Mark A. Caprio, University of Notre Dame, is installed. The package can be downloaded at https://scidraw.nd.edu/.
- The SciDraw package allows the preparation of publication-quality scientific figures.
- The FigColumn function automatically produces simple figure columns with SciDraw, and styling options are limited.
- More flexibility can be achieved using the SciDrawPlot function, which is produces a DataPlot object which can be included into complex SciDraw figures.
- The FigGrid function can be used to produce figure grids with more than one column.
- The Fig function can be used to automatically produce single figures with SciDraw.
- FigColumn takes the same options as Figure, Multipanel and DataPlot (from the SciDraw package) with the following additions:
-
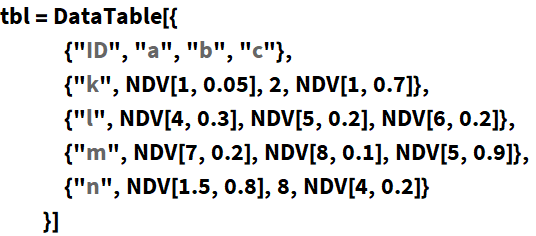
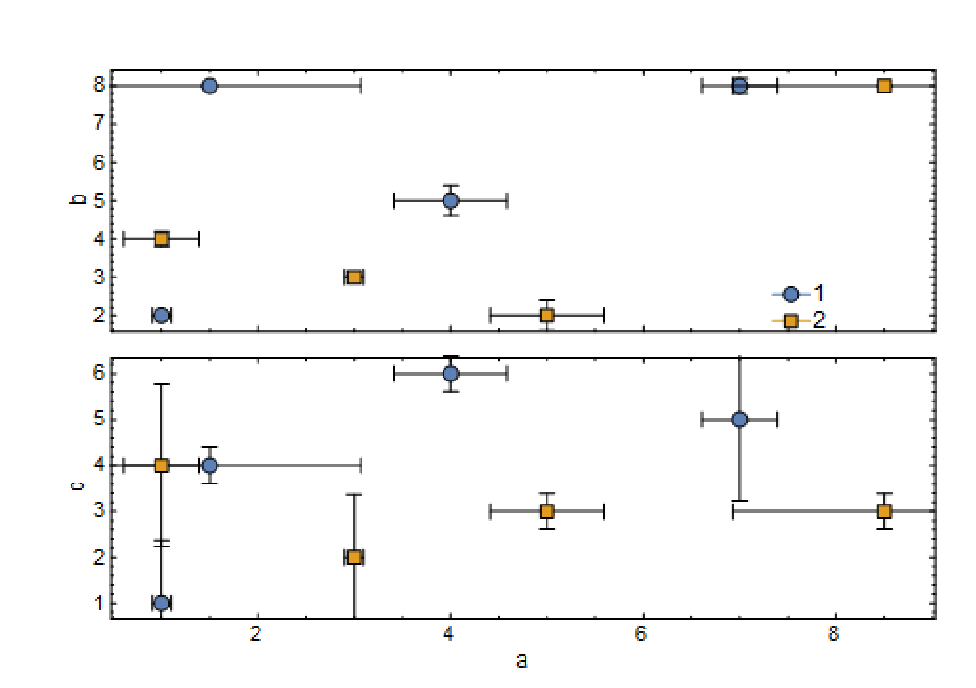
Define some data:
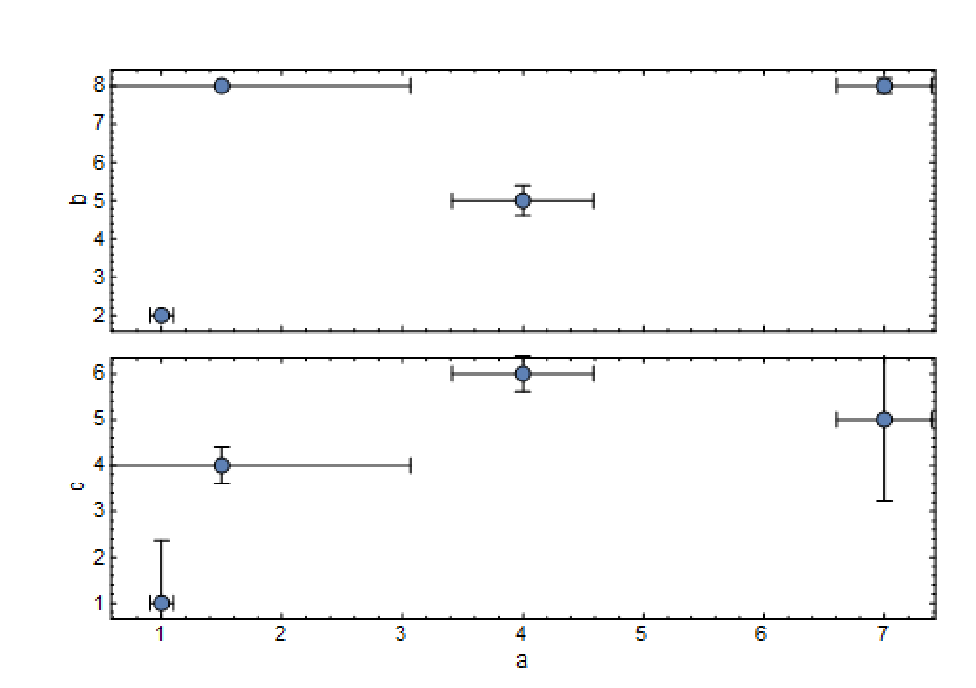
Draw a column of figures plotting a on the x-axsis and b, c on the y-axis:
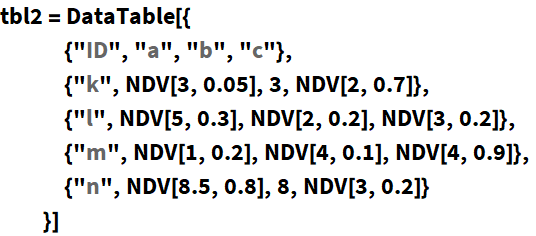
Define a second DataTable with more data and plot it in a second column:
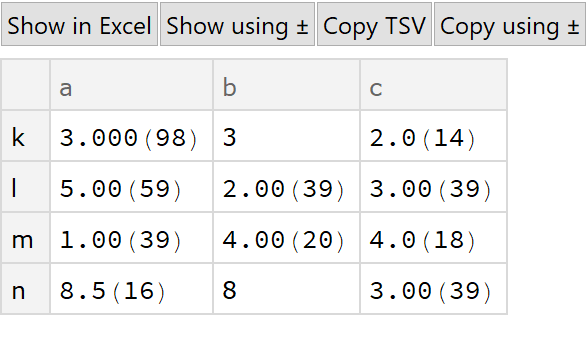
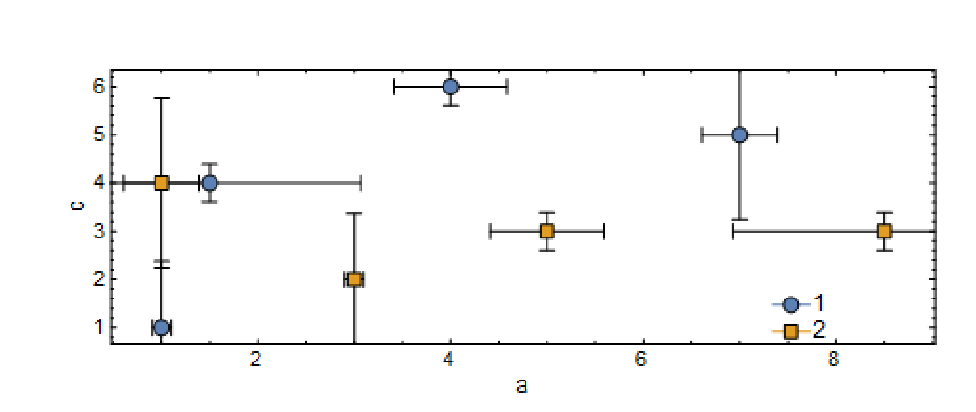
Plot only column "c" as the y-axis: