Examples
| In[1]:= |
Uncertainty propagation
Carry out simple forward propagation of uncertainties in an algebraic functions (95% confidence intervals are shown):
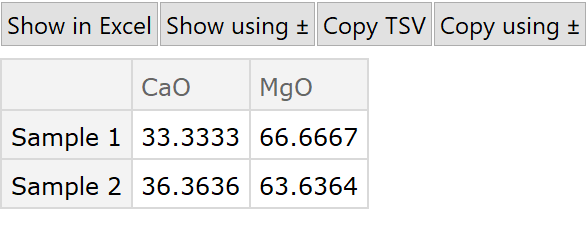
Show confidence intervals with ± instead of in parentheses:
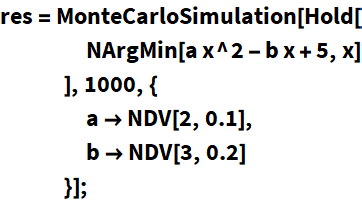
Carry out a Monte Carlo simulation (optionally with parallel kernels) with a numerical function and input parameters with uncertainties and 1000 iterations:
| In[6]:= |
Display the resulting mean and standard deviation:
Display sensitivity plots, which can be used to identify input uncertainties that affect the variance in the result, and explore the simulation data:


Data tables
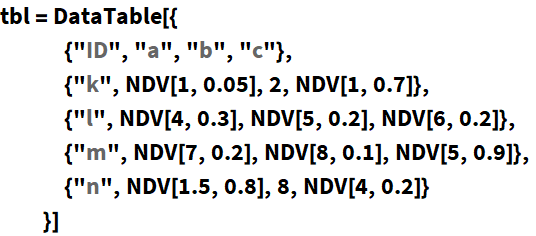
Construct a DataTable from an array of data or associations. The buttons can be used to show the table in Microsoft Excel (in Windows systems) or copy it to the clipboard as tab separated values (TSV):

Use a queries and other Dataset functions to the results with automatic uncertainty propagation:

Use functions or operators such as FoldValues, GroupByKey, MeanAndStandardError, PartitionAssociation, QueryTo for transformations of data tables:

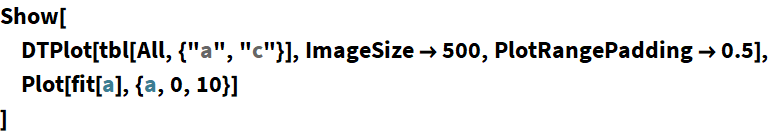
Construct an effective variance fit, fitting the data to a non-linear equation under consideration of uncertainties in all variables:

Plot the data using error bars (the SciDraw package can also be used):

Calibration of chemical data


Load known concentrations of calibration standards and measurement data (more than one element, isotope or compound can be used):


Show the calibration curve, optionally subtracting blank measurements and using a quadratic calibration curve:


Calibrate the measurements by interpolating standard and drift measurements based on the time of analysis:


Conversion
Define chemical components using the chemical formula:
| In[21]:= |
Convert between from a mass to a molar amounts:
Input some sample compositions and convert to a different set of chemical components and project from components:


Calculate the coefficients for the cations for a mineral formula for a given number of oxygens:

PHREEQC
Open a link to IPhreeqC (a library for the popular USGS geochemistry software package PHREEQC) and load a database:
| In[27]:= |
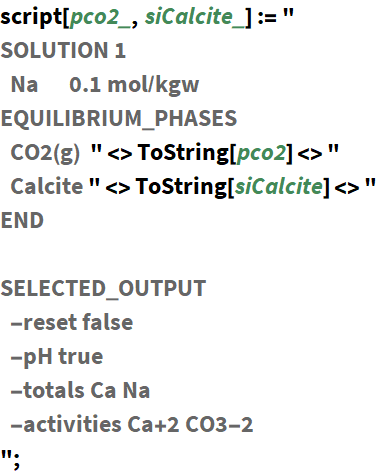
Define a PHREEQC script with variables:
| In[29]:= |
Run the script and return the full SELECTED_OUTPUT:


Run a Monte Carlo simulation with PHREEQC and uncertainties in the input variables:
| In[32]:= |


Data import
Import data from common file formats in analytical chemistry, for example mass-spectrometer .exp files:
| In[36]:= |

