DATA ANALYSIS PACKAGE SYMBOL
CalibrationPlot

CalibrationPlot[datatable,standardData,column,{standardPattern1,standardPattern2,…}]
plots the measurements in a specific column (e.g. compound) of the DataTable for the standards matched by each standardPatterni vs. the corresponding concentrations specified by the standards.
CalibrationPlot[datatable,standardData,{column1,column2,…},{standardPattern1,standardPattern2,…}]
plots the measurements in a series of columns (e.g. compounds).
- The CalibrationPlot function allows the inspection of the calibration curves for a set of analyses of compositional (chemical) standards of known composition.
- The CalibrationPlot function is closely related to the CalibrateCompositionalData function, which processes raw data of compositional (chemical) analyses using a set of standards of known composition to calculate concentrations of chemical elements, components, isotopes, etc.
- The following options can be given:
-
| IncludeConstantBasis | False | IncludeConstantBasis is an option for LinearModelFit and other fitting functions that specifies whether a constant term should be included if not explicitly given in the list of basis functions. |
| BlankPattern | Null | BlankPattern is an option to specify a string pattern that matches the row keys (IDs) of all blank measurements. |
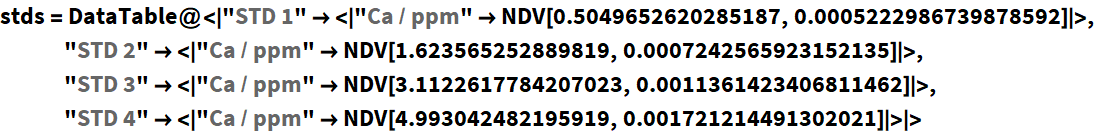
Load known concentrations of calibration standards and measurement data (more than one element, isotope or compound can be used):
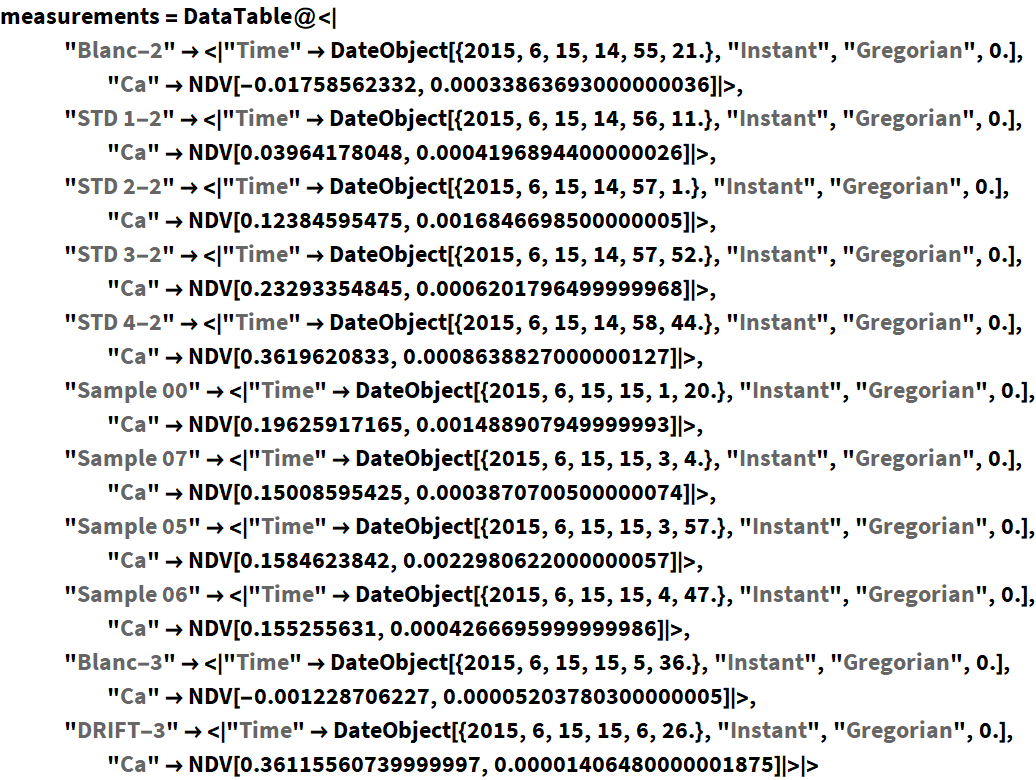
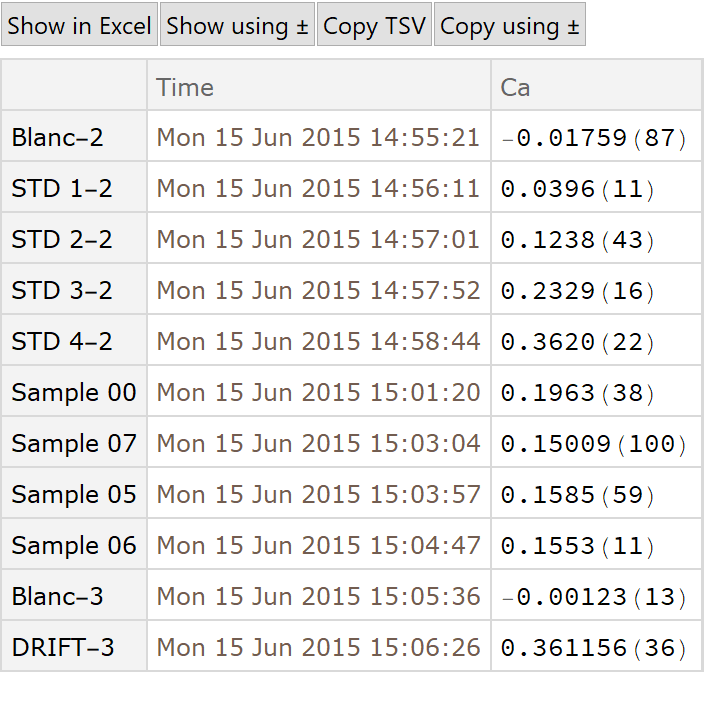
Define some measurements:
Show the calibration curve for a simple linear calibration through zero: